Managing HWRT in Instance-Heavy Scenes
Opening Notes
For context it’s important to know that we’re building a dense open-world forest. By using our own Nanite assemblies created with Blender Geometry Nodes and then spawning those at scale in an open world using PCG. Trees, branches, foliage, etc, are heavily instanced, so at any given time the scene contains a very large number of visible instances. Since the start of the project we’ve used virtual shadows and software ray tracing lumen as our lighting solution.
Later when we began evaluating hardware ray tracing as an option, we saw that some costs went way up! What first seemed like a simple quality upgrade turned into a deeper investigation into culling, acceleration structure management, and GPU pressure.
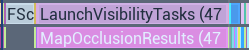
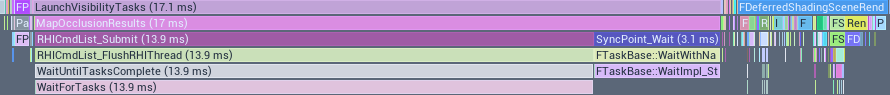
When we started to investigate these costs in Unreal Insights, one thing really stood out; MapOcclusionResults. It could spike to +40 ms on occasions!
This post covers how we approached getting ray tracing performace back under control in an instance-heavy environment.
Switching to Hardware Ray Tracing
Nested under MapOcclusionResults we could see STAT_MapHZBResults, telling us what was actually being worked on, the Hierarchical Z-Buffer occlusion processing.
MapOcclusionResults is essentially the point where the engine collects occlusion results, and why this suddenly exploded when we turned on HWRT had to be investigated.
Most of the +40 ms turned out to be the game thread waiting for the GPU to finish its work. When the CPU reached this point it waited for the GPU to catch up.
To verify this, I opted out of HWRT to check if the cost of MapOcclusionResults was the same without HWRT. And it was, around 17 ms but without the +40 ms spikes. What changed with HWRT was that the overall GPU pressure grew.
So why did the GPU suddenly become so busy when we switched to HWRT?
Ray Hit Cost
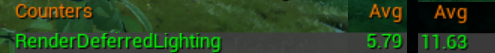
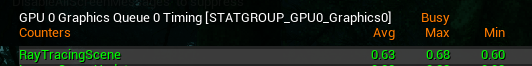
Looking at the GPU stats we could see that it indeed had become very busy, the GPU Time was ~30 ms and the most significant increase was RenderDeferredLighting, which climbed to roughly ~11 ms.
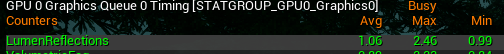
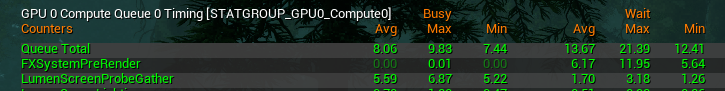
Another thing that grew, was LumenReflections. It could get as high as ~2.4 ms and this is higher than expected given that the scene is dominated by rough materials with no visible reflections. And lastly the LumenScreenProbeGather grew to ~6 ms.
I will go into detail of what these stats represents further down.
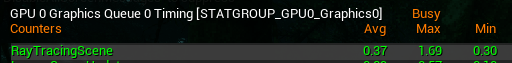
Comparing the cost of RenderDeferredLighting SWRT to HWRT in a rather GPU taxing scene. HWRT to the right.
LumenReflections grew with 0.5 - 2ms.
LumenScreenProbeGather grew with ~3ms.
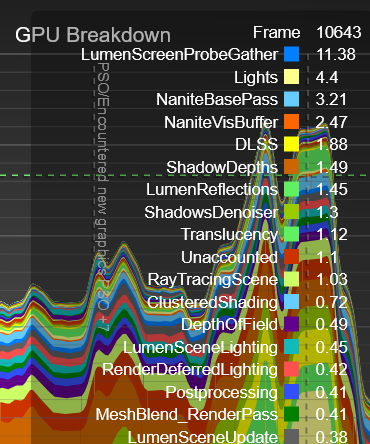
On our target hardware, LumenScreenProbeGather could spike beyond 11 ms.
Suspicion grew that our ray tracing hit evaluation were simply too expensive. Which wasn’t too surprising since our materials use a lot of virtual texture lookups, effects and triplanar mapping.
So how do we reduce GPU pressure by lowering the ray hit cost?
Optimizing Ray Hit Shading
First I went for some quick wins and switched ray lighting mode to surface cache instead of hit lighting mode, since most of the surfaces in the scene was rough the visual impact was minimal.
You can read about the difference between surface cache and hit lighting in the unreal documentation. But in short; hit lighting evaluates the lighting at the actual ray hit instead of sampling the lower quality surface cache and thus is more expensive.
I also turned on texture LODs for ray tracing, this enables automatic mip selection in ray tracing materials instead of always sampling the highest-resolution textures. These two options alone gave me ~2 ms.
Now I made sure that only actors of a certain size was included in the ray tracing scene. I wrote a editor script that evaluated our assets bounding size, and automatically excluded anything below a defined threshold. The actors that was too small got contact shadows instead. This significantly reduced the number of ray-traced instances.
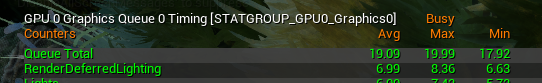
Progress! After these changes MapOcclusionResults stayed stable at ~17 ms.
Capture with MapOcclusionResults reduced to roughly 17 ms.
While this was clear progress, the GPU was still under heavy pressure, and ~17 ms was still more than we could afford, even if the cost was now stable.
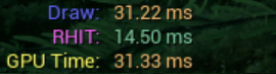
GPU time was still very high.
Now I wanted to get back on track and focus on getting the GPU pressure down and making the ray hit cost even lower.
Ray Tracing Quality Switch
This made me revisit our materials. I started going through the worst offenders and wiring them to the RayTracingQualitySwitchReplace node, making sure that our ray traced evaluation path was cheaper wherever possible.
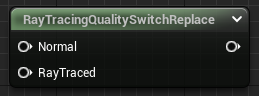
I stripped the ray tracing branch down to the essentials. In addition to removing normal maps, subsurface, and ambient occlusion, I tried to remove as many texture lookups as possible and replace them with constants.
Reflection Cost
Since the scene is dominated by rough foliage and has very few surfaces that actually benefit from high-quality reflections, we could lower the roughness thresholds for traced reflections without almost no visual difference:
r.Lumen.Reflections.MaxRoughnessToTrace = 0.2r.Lumen.Reflections.MaxRoughnessToTraceForFoliage = 0.2
This prevents Lumen from tracing reflections with dedicated rays on pixels with roughness higher than the threshold.
I also downsampled the reflection quality by half with r.Lumen.Reflections.DownsampleFactor = 2.
Debug view showing areas where dedicated reflection rays is being traced on. In this case; pretty rough foliage and rocks, which accounted for most of the reflection cost when left on default settings.
With these changes in place, the reflection pass dropped to roughly ~0.4, a big reduction compared to the earlier ~1 ms
After confirming that the reflection workload was now under control, I enabled asynchronous compute for reflections. This allows parts of the reflection work to overlap with other GPU tasks instead of blocking the graphics queue, helping to further reduce overall GPU stalls.
Screen Probe Gathering
Screen probe gathering is lumens way of calculating diffuse indirect lighting. It traces rays from a grid of screen-space probes and integrates the lighting over time. In scenes with dense, aggregate geometry, like our forest, probe density and tracing settings have a major impact visually and performance wise.
Early on, we decided to enable r.Lumen.ScreenProbeGather.ScreenTraces.HZBTraversal=1.
Given the amount of thin geometry in our forest, activating HZB traversal significantly reduced light leaking, giving foliage more depth.
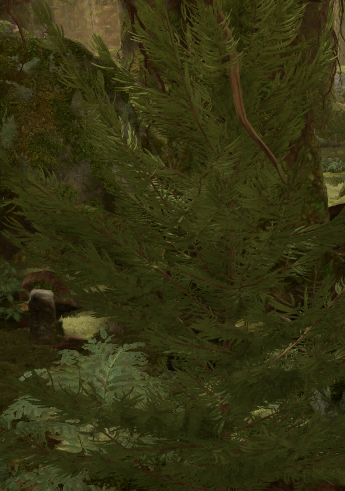
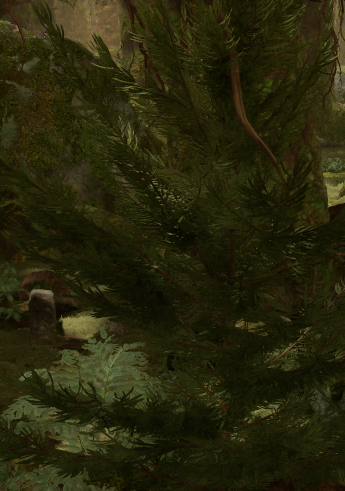
Comparing HZB traversal on and off. On to the right.
The downside is cost, HZB-based traversal is roughly three times more expensive (according to Epic) than the simpler traversal mode.
To counter the expensive traversal cost, we changed r.Lumen.ScreenProbeGather.DownsampleFactor from 32 to 64 and r.Lumen.ScreenProbeGather.TracingOctahedronResolution from 8 to 6. This reduced the cost of LumenScreenProbeGather with ~3 ms.
After raising the downsamplefactor and tracing resolution the LumenScreenProbeGather cost went down to ~2.3 ms.
Ideally, these settings should be exposed through a graphics options menu, allowing players to decide how high indirect lighting quality they want versus performance.
Acceleration Structure Cost
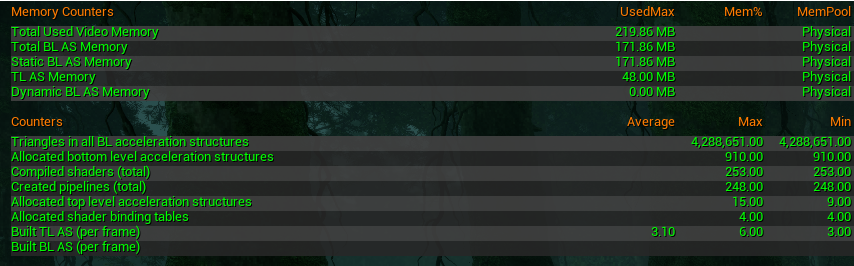
Looking at the stats more closely, it became clear that the ray tracing scene itself was expensive. TLAS and BLAS memory alone could reach up to ~250 MB and the Finish Gather Ray Tracing Instances cost was ~2.7 ms.
Which raised the next question; why was the ray tracing acceleration structure consuming so much memory and how come it takes almost 3 ms to gather the instances?
Unreal’s ray tracing acceleration structure is built as a two-level BVH (bounding volume hierarchy); TLAS (top level acceleration structure) that contains all the instances in the scene and BLAS (bottom level acceleration structure) for the underlying meshes. If you want to read more about the details you can visit Epics documentation.
Why the Acceleration Structure Was So Expensive
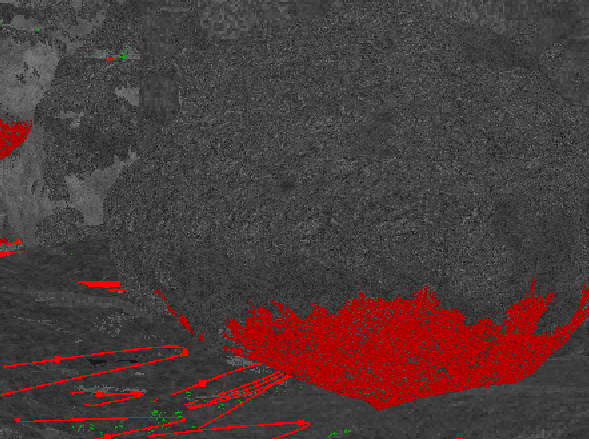
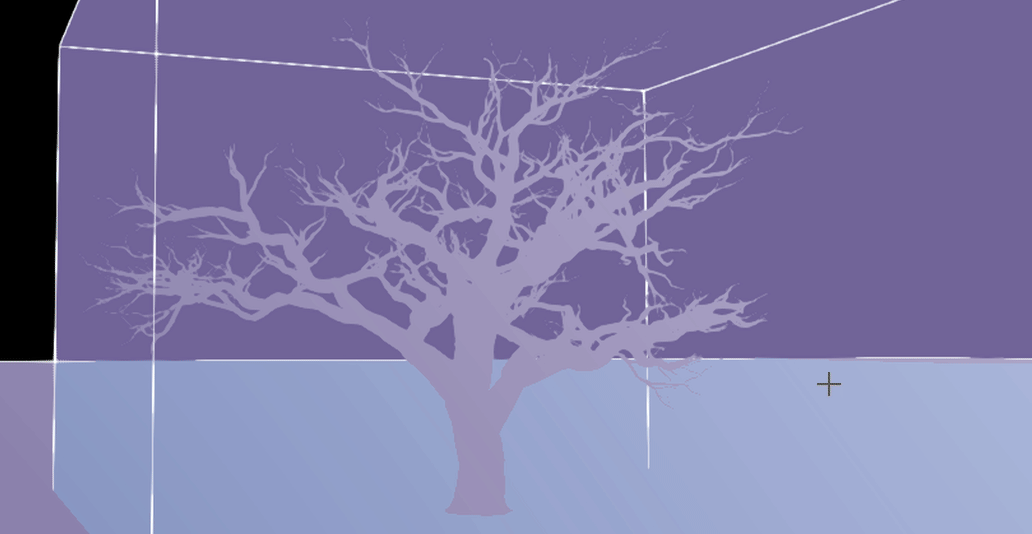
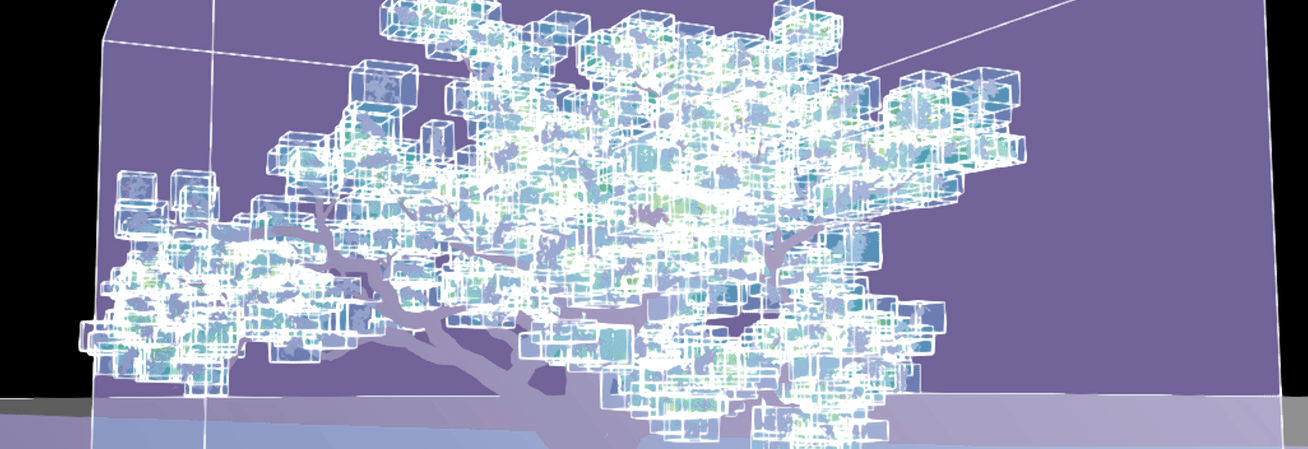
A quick look at the TLAS in the debug view explained why the acceleration structure consumed a lot in memory, but also why the occlusion cost was so high.
.png)
Capture from the TLAS debug view. The view contains a bunch of nanite assembly trees with a lot of instances.
As you can see, the number of bounding volumes is massive. What you are looking at is the bounds for a bunch of Nanite-assembled trees. Each branch with its own bounding volume. Culling those instances is essential for ray traversal performance, but the culling process itself comes with overhead, especially at this scale. Merging these instances would be good for TLAS but very bad for BLAS, streaming, culling and ray traversal cost. And on top of that we have game feature requirements that needs them separated.
In some frames, the Finish Gather Ray Tracing Instances cost alone reached ~2.7 ms.
When looking at the Finish Gather Ray Tracing Instances pass in Insights, it was also clear that additional work related to instance gathering and culling was happening outside of that single stat.
Due to the nature of Nanite assemblies and the dense forest we can have ~150k active ray trace instances in the scene at once.
Not surprising then that culling, instance gathering and TLAS-related work started to take a big part of the frame.


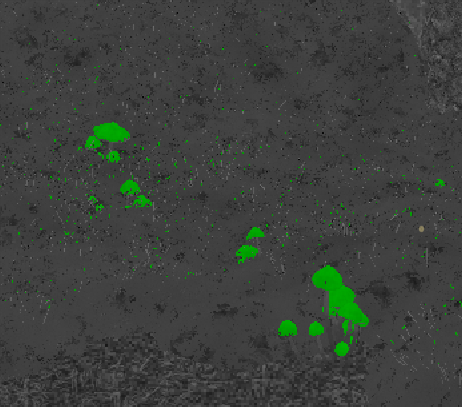
Capture of the stat scenerendering showing the gathering cost of ray trace instances and the amount of active instances.
In an attempt to get the active instance count down, I changed the culling setting to r.raytracingculling 3, which is the most aggressive culling setting. It uses both distance culling and frustum culling. Since we do not have that much reflective surfaces, frustrum culling the RT-instances sounded like a good idea. And now after culling only ~18k instances survives and the cost of gathering them has gone down to ~0.03 ms!


Capture of the stat scenerendering showing the gathering cost of ray trace instances and the amount of active instances when using aggressive culling.
Raytracing Group Ids
To get the culling overhead cost under control, we’ve started using Ray Tracing Group Ids on our instances. For scenes with a very high instance count, Epic and NVIDIA recommend grouping related instances so they can be culled as a single group instead of individually. Components that share the same group id can be culled together, reducing per-instance culling work.
All instances of a Nanite-assembled tree being culled individually (left) compared to being grouped under one Ray Tracing Group Id (right).
In practice, this means assigning a shared Ray Tracing Group Id to all our assemblies generated so that whole clusters of pieces could be treated as one object during culling.
The work with group ids is ongoing as I write this post, so the result of this is something I will have to write about in another post. Stay tuned.
Compacting Ray Tracing Instances
But something that is actually already done and tested, is the enabling of the setting r.RayTracing.Scene.CompactInstances. That setting compacts the list of ray tracing instances that are actually used in the TLAS, rather than always rebuilding and processing the full set of potential instances every frame.
The trade-off is that compaction introduces a small amount of latency when the active instance set changes. According to the documentation up to a couple of frames, but in return it reduces per-frame work over the entire TLAS. And that’s exactly what we needed in our instance-heavy scenes.
Uncompressed ray tracing instance list compared to a compressed. Compressed at the bottom.
Buffering Occlusion Queries
I also changed r.NumBufferedOcclusionQueries to 3, default is 1. It controls how many frames of occlusion query results are buffered before the CPU reads them back from the GPU. Increasing this value can reduce stalls by allowing the CPU to run slightly further ahead, but it also increases the latency of occlusion results. So far I haven’t seen any visible latency.
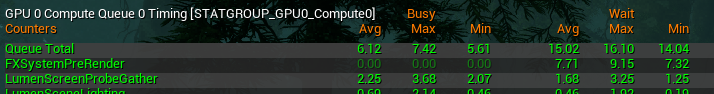
Results
With all of the changes in place, let’s check the costs again.

Much better results. GPU pressure is reduced, MapOcclusionResults lower and stable, and the ray tracing scene cheaper.
Ending notes
The main takeaway for me was that switching to HWRT is not as straight forward as you would think. We had to tweak hit shading cost, reflections, probe gathering, AS construction, instance counts, and occlusion to get the stalls under control. Ray Tracing Group Ids are not fully implemented yet, and depending on how far they get us, we may need to revisit how assemblies are built or we’ll have to batch instances together or reduce them. That said, almost all of our content is tied directly to gameplay and interaction, so those solutions are not trivial in our case.
If you’re interested in reading more like this, I highly recommend Iri Shinsoj’s and Nikhil Maurya blog posts on Nanite performance.
I hope you found this post useful, or at least picked up a few ideas that might help when working with HWRT in a large instance-heavy scene.
Comments
Reply on Bluesky to leave a comment.