Optimizing Mannequin
Opening Notes
This post is for the people who squeezed every last millisecond with me on Vampire: The Masquerade - Justice and on Mannequin. Special thanks to engineering for turning a dead end into the Snow Occlusion plugin.
Indirect Light Memory Bloat
When I joined the company and landed on Vampire: The Masquerade - Justice, I was surprised to learn that baking the lighting for a single level took most of a day. This was before we switched to GPU bakes, but even for CPU Lightmass it felt painfully slow.
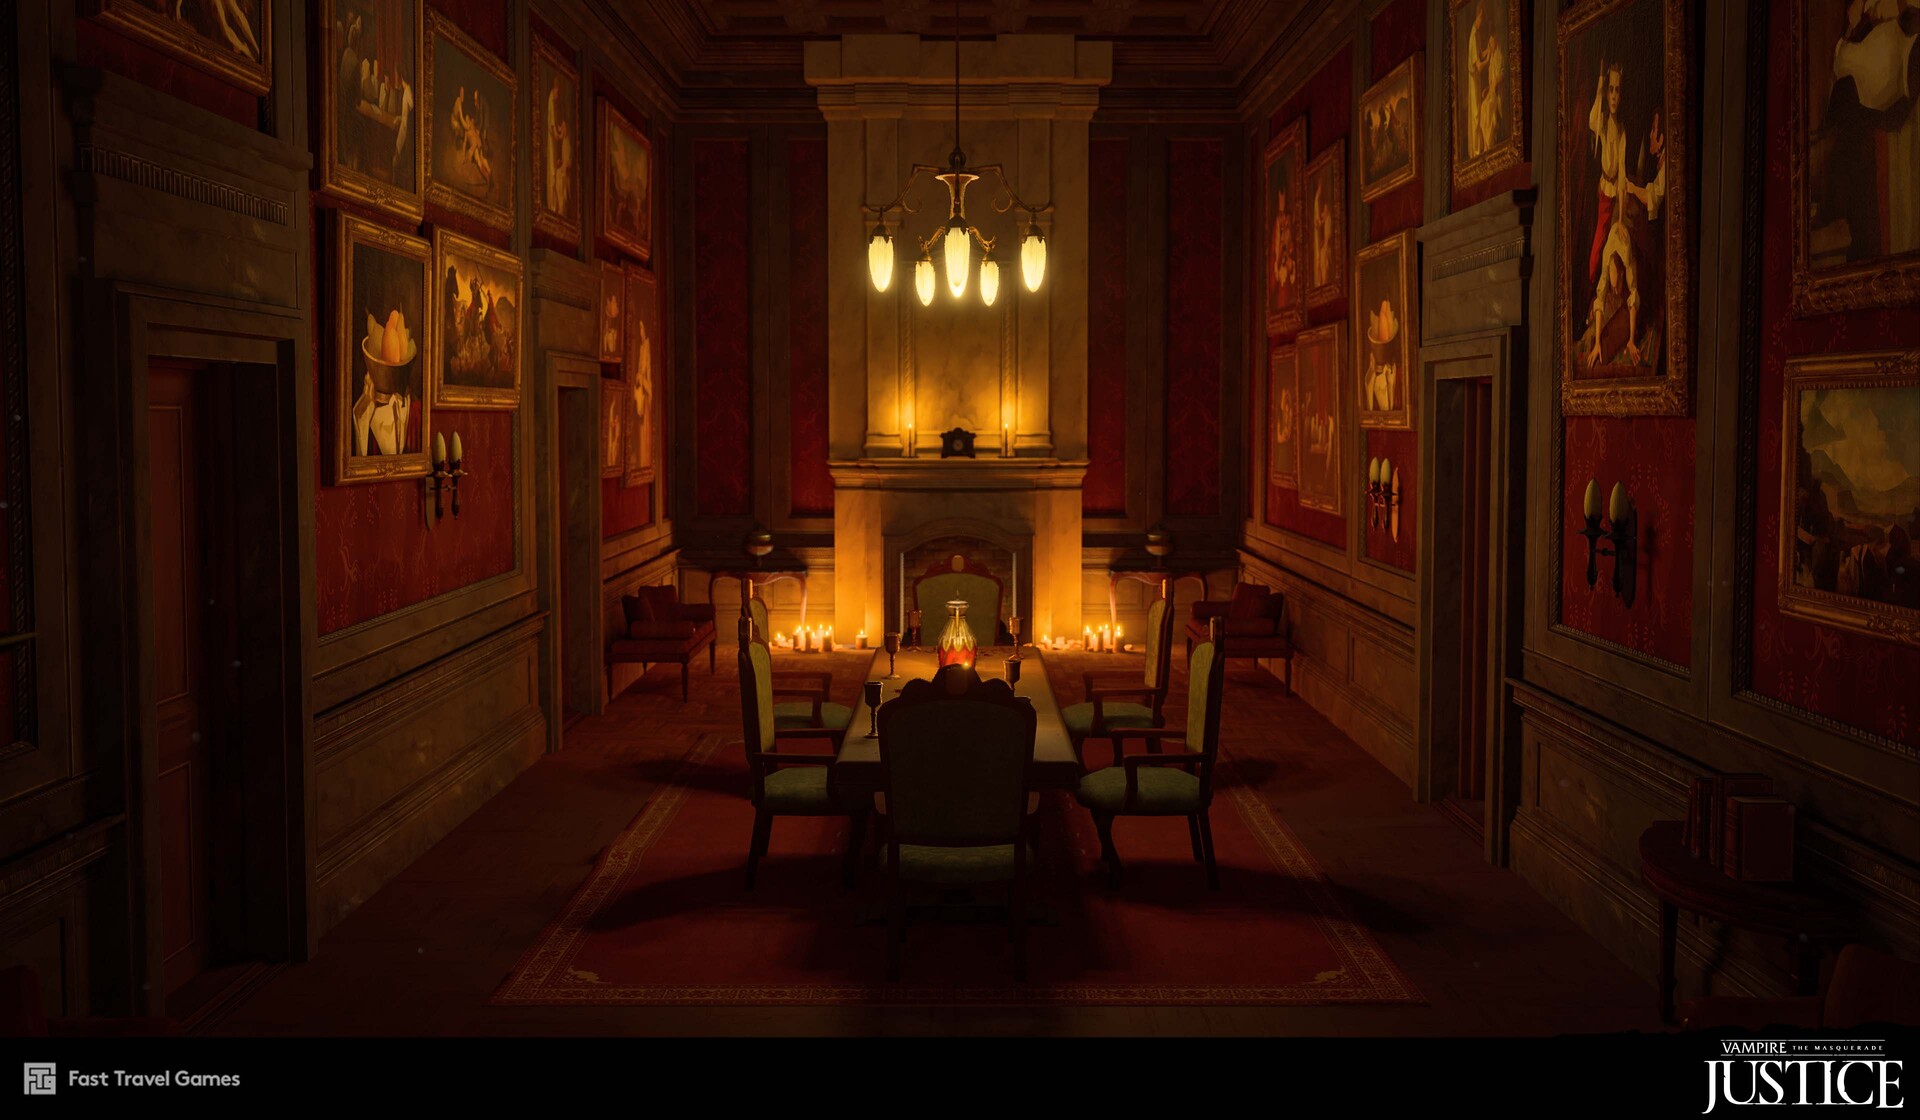
Image from Johanna Petterson.
When investigating the reason for this, I noticed that MapBuildData stood out. It was huge, eating disk space and VRAM.
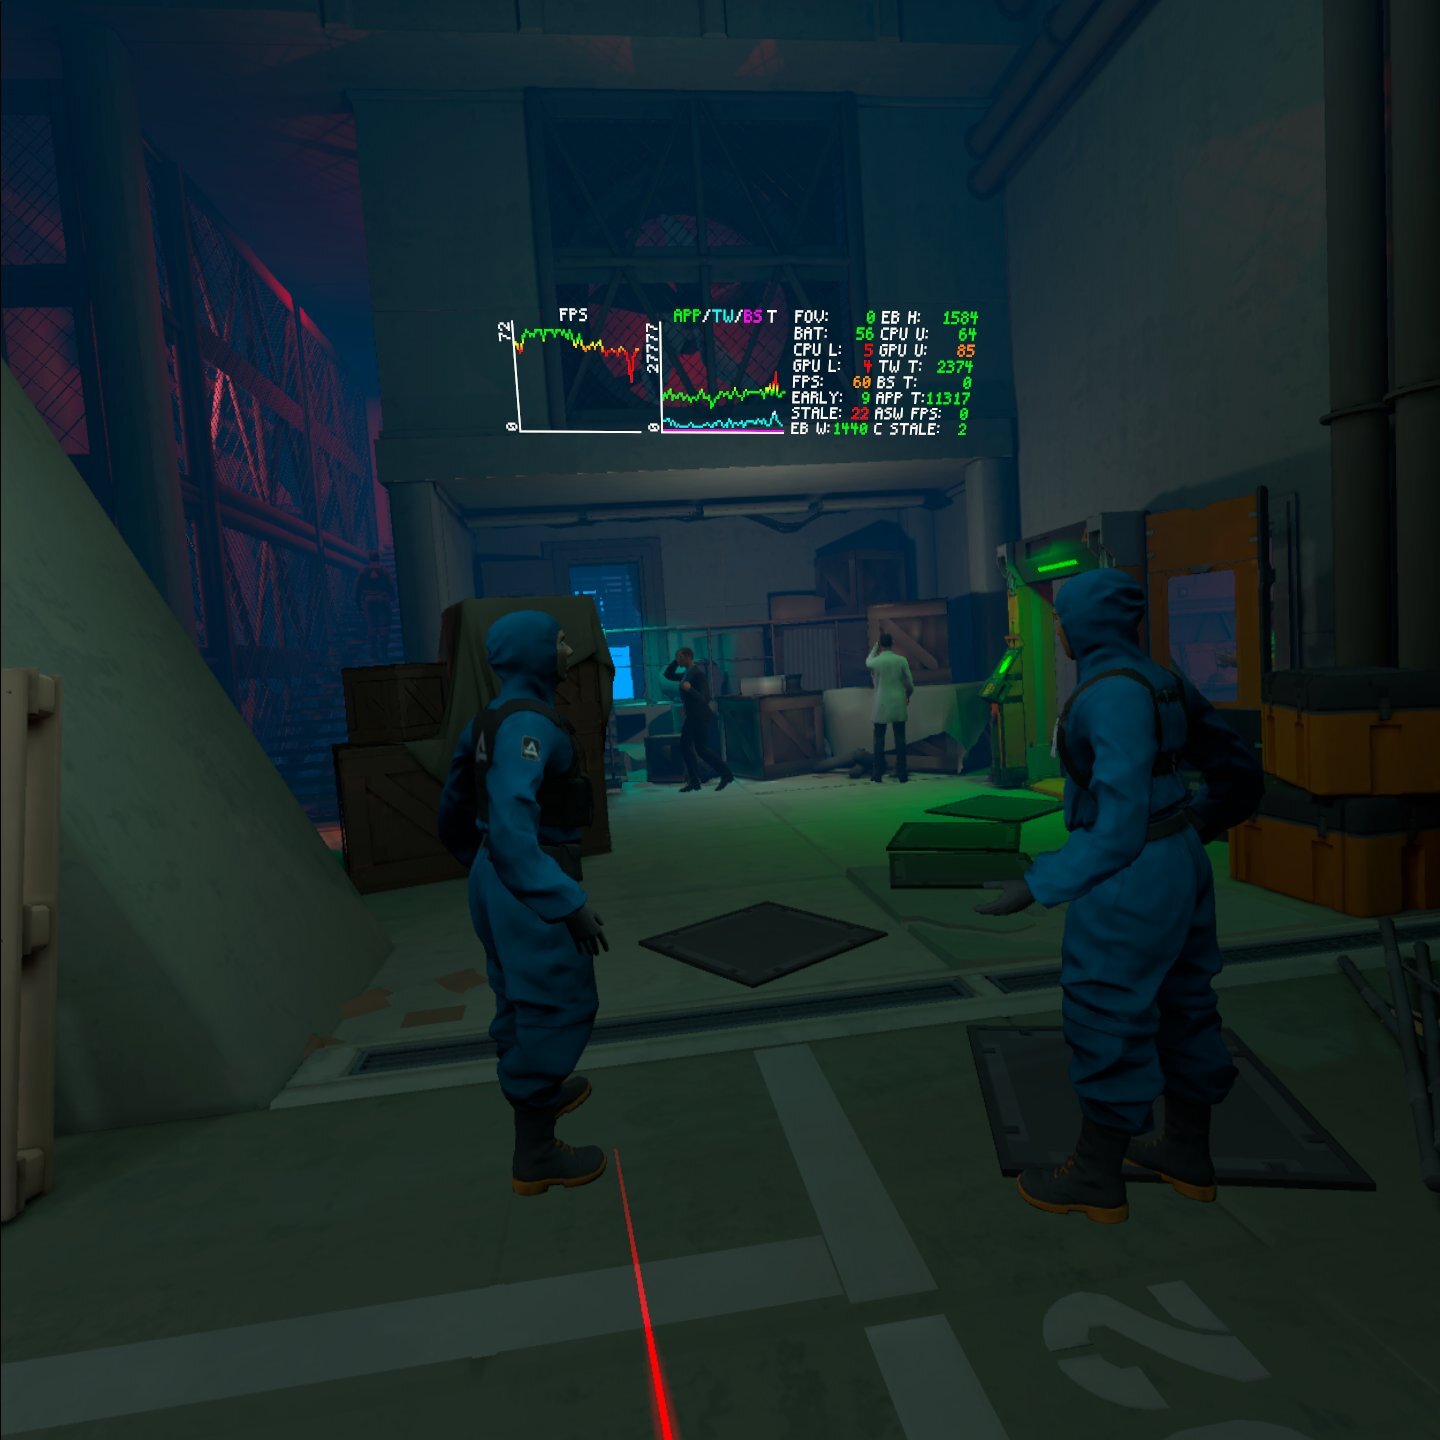
Running stat MapBuildData made the culprit obvious, it was Volumetric Lightmap memory that took all the space.
The debug view confirmed why; the sample points were dense and everywhere.
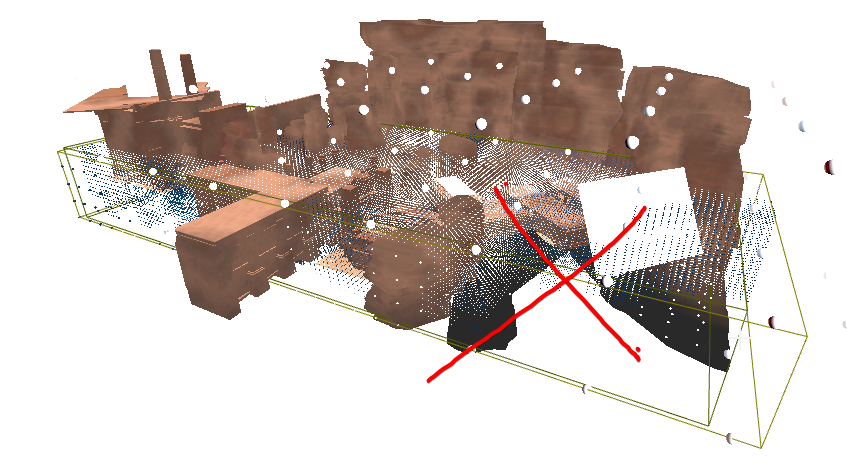 This image is unrelated to the Vampire project, but it illustrates the problem clearly: a dense field of VLM samples, much of it outside the playable space.
A single Lightmass Importance Volume wrapped the entire level, and the Volumetric Lighting Detail Cell Size was set very small. The result was a sea of samples, even in empty, unplayable space. Our Vampire levels were much larger than the example above, so the waste scaled even worse.
To solve this, we removed the single volume and instead used multiple importance volumes that hugged actual playable areas. Then we scaled up the detail cell size where we could.
Bake time dropped by hours. Volumetric Lightmap memory fell by about 60–70 percent. Indirect light quality stayed about the same in the spaces that matter. The only drawback was that level design had to place the volumes manually.
Lesson learned. We carried that approach into Mannequin from day one.
Culling
Because most of our assets were modular, draw calls spiked early in production.
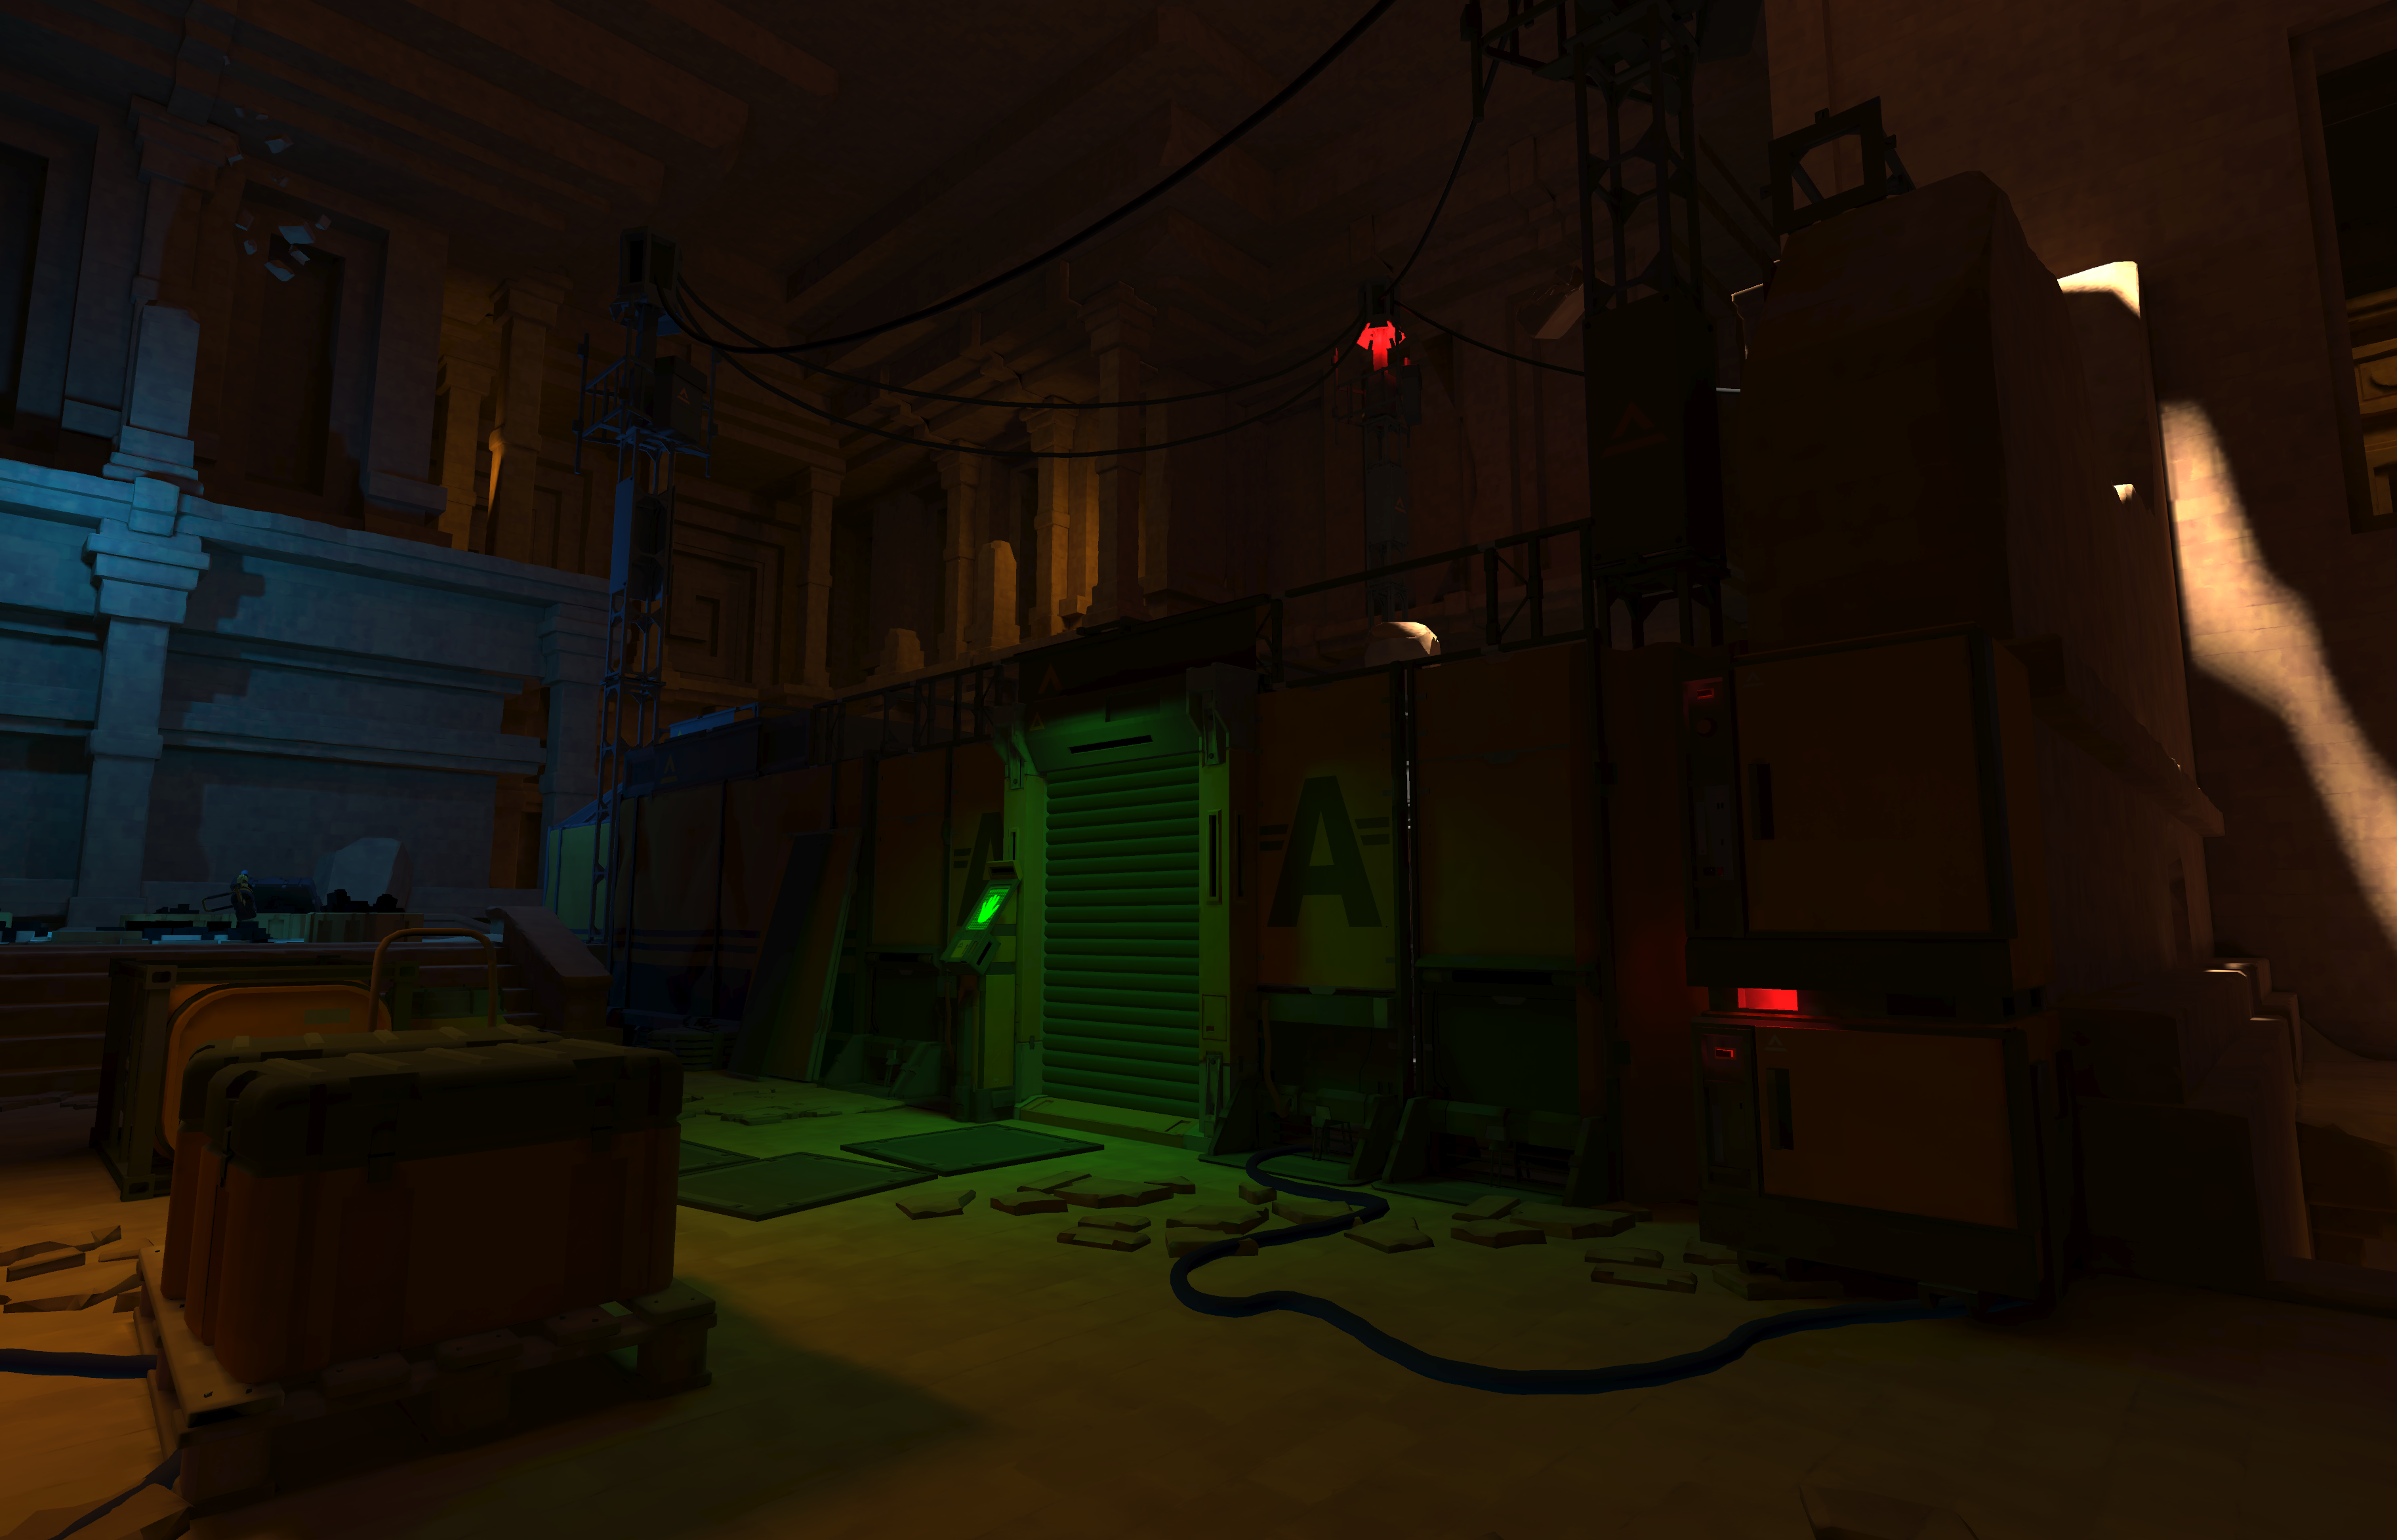
A scene in Mannequin built from many modular pieces, one of the reasons draw calls became a problem.
In earlier titles we leaned on Unreal’s Software Occlusion Queries. It’s a CPU-side culling method that rasterizes a chosen LOD of meshes as occluders, then tests other objects against that depth to skip drawing what’s hidden.
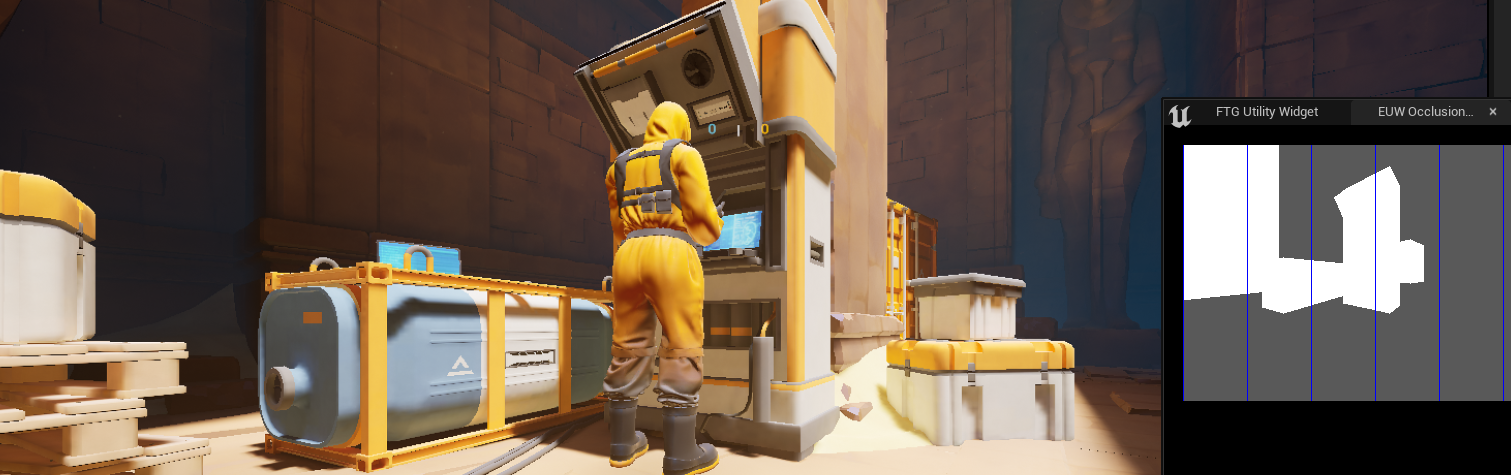 The Software Occlusion Queries debug view. The image in the lower-right shows occluder meshes being rasterized and used for culling.
With UE5 that option disappeared, which was a major issue for us since we’re usually GPU bound on the Quest. We needed alternatives that didn’t use the GPU.
Precomputed Visibility Culling
We evaluated Precomputed Visibility Volumes first. It’s basically a lookup table that divides your level into cells. When entering a cell it checks what other cells you can see from that cell and turns the rendering of the actors in the cells you can’t see off. At a glance it looked good. In practice it comes with strict limits. Everything needs to live in the persistent level, dynamic actors don’t occlude, and the resolution of the volume grid matters a lot.
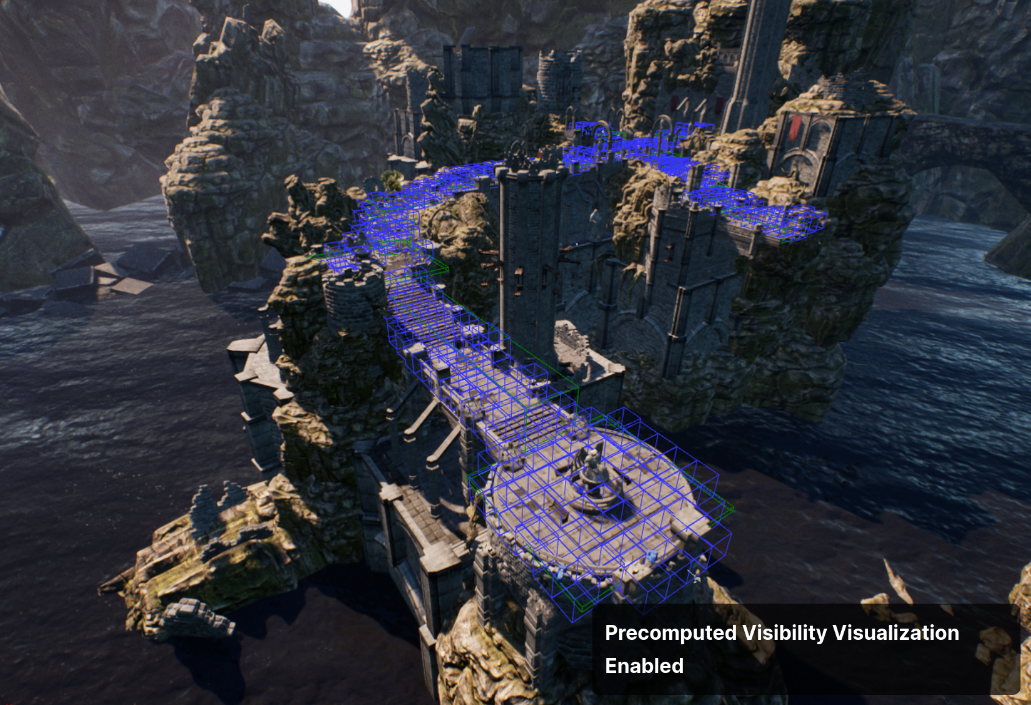 Precomputed Visibility Cells.
Image Source: Unreal Docs
Precomputed Visibility Cells.
Image Source: Unreal Docs
If your walls are thinner than the precomputed-visibility grid size, the system can see through them.
When the player stands in a visibility grid cell close to a wall, and the cell extends through the wall, the visibility pass treats the space behind the wall as visible and draws everything on the other side.
We used a 50 cm grid, which forced a redesign of many walls. The bigger issue was our use of modular walls.
The narrative of the game was that the levels were dressed quickly, by responders investigating the alien presence. And they used wall modules everywhere to make rooms ad hoc.
These modules are thin and has a lot of negative space. You could see through them from many angles.
We redesigned most of the wall module kit to fix this, but the nature of modular walls remained. You can often see over them, which keeps visibility open even after the redesign.
Level design would get very boring if everything became a maze with enclosed walls and no sightlines.
Another issue was that cells are only generated on static, shadow-casting meshes.
This meant there were many areas without any cells, like elevator shafts. If the camera occupies an area without cells, you get no precomputed culling at all, and frame rate drops.
.png)
An elevator shaft: as soon as you enter the cab (red area), there are no precomputed cells (blue).
It became clear we couldn’t rely solely on precomputed visibility. There were too many drawbacks.
Snow Occlusion (software occlusion in UE5)
Fortunately our CTO ported and extended UE4’s Software Occlusion Queries to UE5; Snow Occlusion Plugin. It keeps the original foundation but adds the features we needed, because the original implementation was too limited for our use.
One of the additions was better debug views:
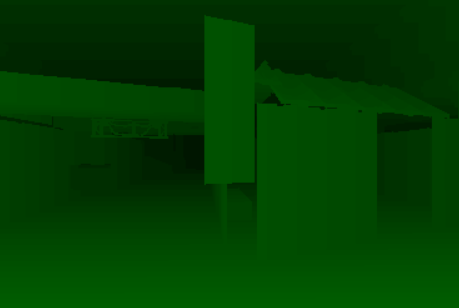
Depth visualization.
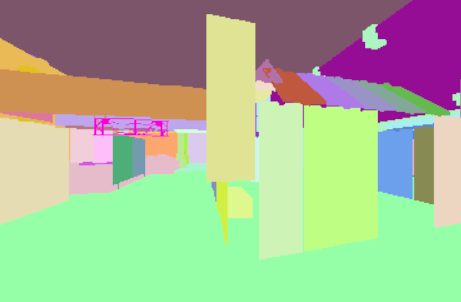
Instance visualization.
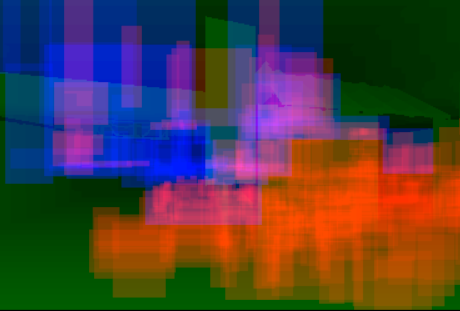
Depth buffer with occludees overlaid and colored by visibility.
Another major upgrade we added was support for a custom occluder mesh, not just a chosen LOD. This was critical for us. Auto-generated LODs of our modular walls left gaps and other inconsistencies that made culling worse. With custom occluders we could seal those gaps and keep the pass cheap by using very simple meshes.
.png)
Modular wall assets with the new depth debug view. Occluder gaps between walls are clearly visible, that makes the culling pass ineffective.
We discovered that actors often popped in too late around corners and behind obstacles due to frame latency and tight tests.
This called for tuning ftg.so.ExpandOccludeeBoxes, which expands the screen-space bounding boxes used for occludee tests. It makes culling less tight and reduces false occlusion and late pop-in, at the cost of some CPU time.
We also saw large floor meshes get culled because their bounds center fell behind the camera. Another setting helped: ftg.so.DotPush. It virtually pushes objects forward along the view vector before the dot-product cull, so they’re less likely to be culled too early.
In a VR thriller shooter you rotate the camera rapidly, which exposed late pop-in from frustum-culled meshes. Previously, the occlusion pass also tried to reject off-screen objects instead of letting Unreal’s normal frustum culling handle that. With ftg.so.FrustumCull you can turn that behavior off. It adds a few extra draw calls, but it reduces visible artifacts during quick turns.
With all of this settled, we finally got rid of all the strange occlusion behavior.
But there were spots in the project that still had issues with too many draw calls.
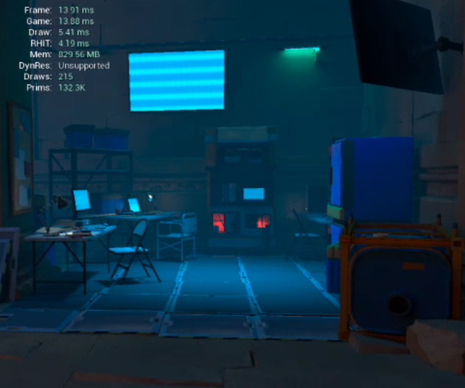
One spot in Mannequin that still had draw call issues due to long sightlines.
Distance Culling
The very first culling we defined was distance culling. I’m putting it here after the other culling systems for one reason; everyone does it. Our approach was to sort actors in different size categories based on a size guide.
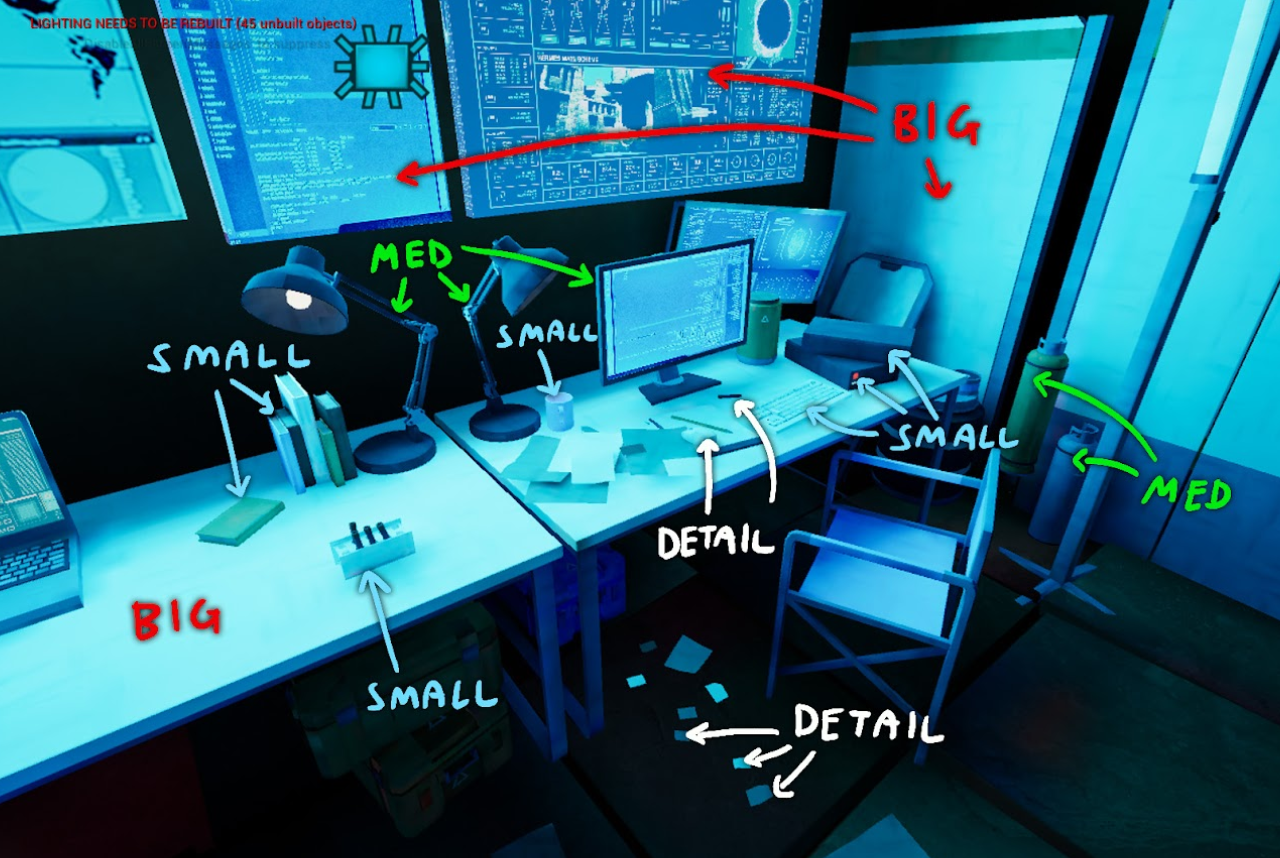
First we used only the actors bounding volume size, but later we ended up sorting some of them manually due to different use cases. Based on their size category they get different default settings like max draw distance, collision profile, LOD settings, shadow casting, etc.
Keeping Draw Calls Down
Culling solved most draw-call problems, but in the end it wasn’t enough. We turned to other solutions to keep draw calls down and rendering cost low.
Detail Props
We also built a Mesh Detail Tool that uses Unreal’s Detail Mode on components to set visibility per platform.
On device we run with r.DetailMode=Low, while PC runs High, so anything marked High will be culled on Quest. It’s purpose was to quickly be able to scale back and forth how much of the detail meshes (paper, gravel, rubble) that should be culled on device to save render cost.
It assigns Detail Mode on the selected actors render components based on a slider that controls how high percentage of the actors that will get the High tier.
- Set a level, then click Detail Scramble: the tool assigns some percentage of the selected meshes to High (hidden on device) and leaves the rest at Low (visible on device).
- Click Reset to put all selected meshes back to Low, making them always visible on device.
- An icon overlay toggle lets you preview which meshes will disappear on device without switching project-wide scalability.
Instance Tool
Unreal’s auto-instancing looked good on paper, but on Quest the overhead wasn’t worth it in our tests.
We switched to manual instancing instead. It meant some manual work, so our goal was to make that as smooth as possible. We’d used actor merging in earlier projects, but I pushed for instancing because it avoids extra memory bloat and, in the long run, is easier to edit if handled correctly.
With that in mind, and given the timeline, we adopted the plugin Instance Tool.
The plugin hides the original actors and replaces them with instances, which fit our workflow well. Going back to the original actors wasn’t as straightforward as you’d think, since most of our actors were Blueprint classes. To remedy this, we added functionality to our tools to make that workflow straightforward.
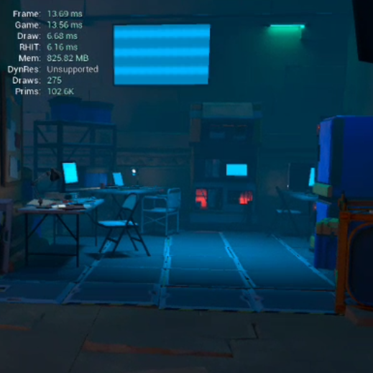
To the left the floor tiles are not instanced, 275 draws. To the right the tiles are ISM, reducing the scene to 215 draws.
After converting groups of static meshes to instances we finally got the amount of draw calls down to an acceptable amount for the Quest 2.
CPD and Color Atlas
We used Custom Primitive Data everywhere we could, to keep draw calls down.
Instead of creating separate material instances we drove variations through CPD; color tints on small and detail props, variations on screens, etc.
To make this practical at scale, I created a tool that allowed artists to edit CPD values on large selections of meshes at once. It makes it easier to batch set cpd values and randomize them between predefined values.
We mainly used this technique on small and detail props that shared the same shader, where instancing and CPD gave us the most benefit for the least complexity.
For medium and larger props we took a different approach. Instead of CPD for the color variations, we used a color atlas that the meshes were UV mapped to. The RGB channels controlled the color variations, and the alpha channel the specular strength.
LOD Bias
To keep the total triangle count low for the GPU to render on Q2 we used Per platform LODs on both skeletal and static meshes. We set the amount of reduction to around 75 percent on characters. And dependent on what kind of category the static asset was, we reduced it to different amounts.
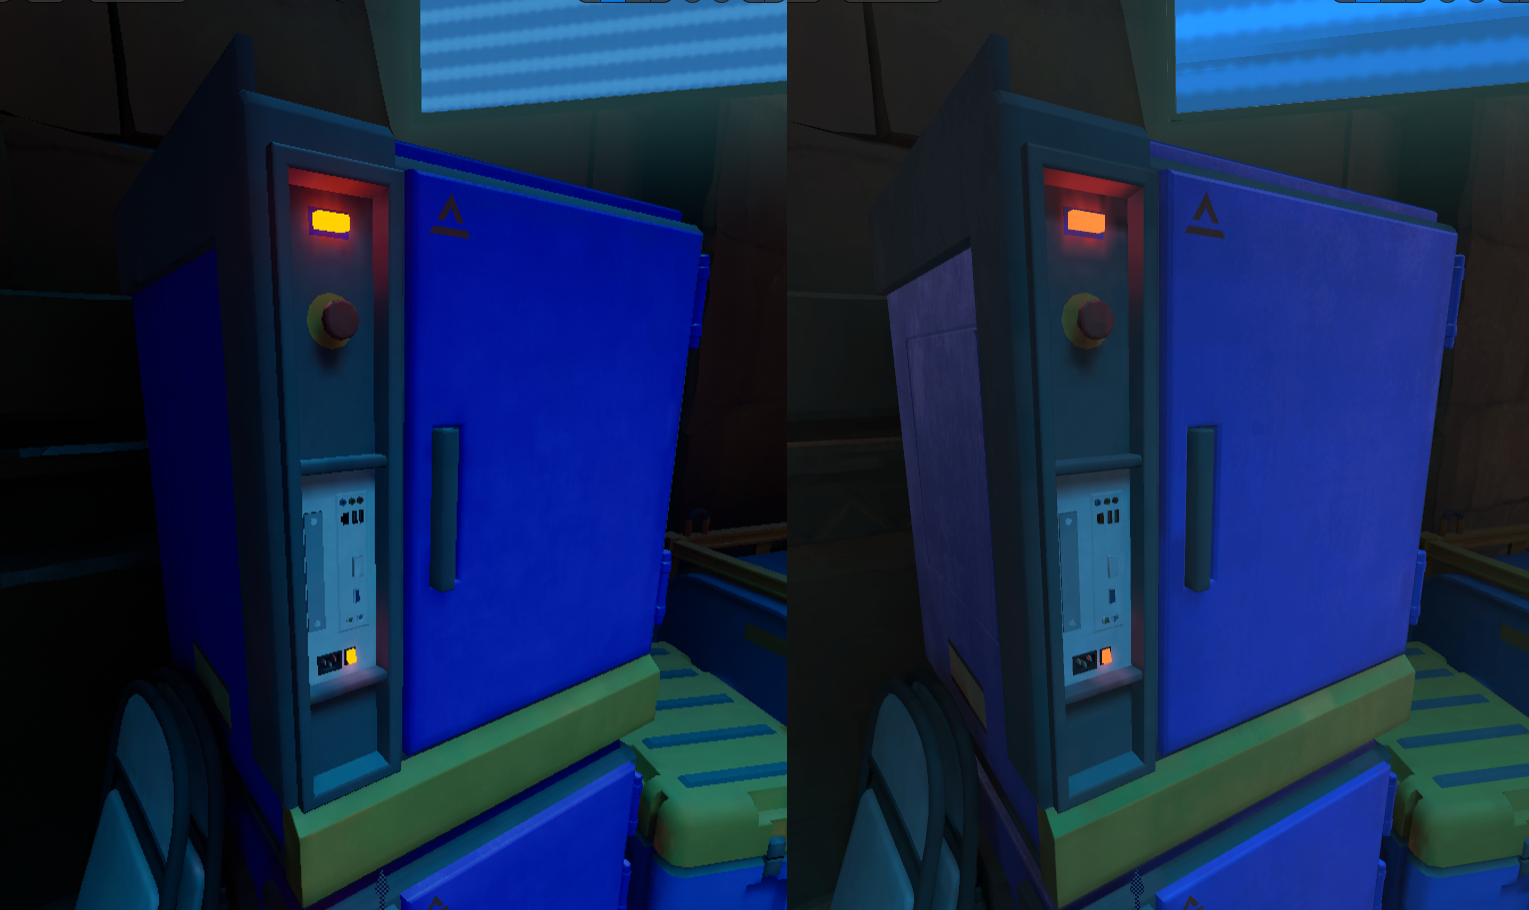 To the left is LOD0 viewed on link and to the right LOD1 with 75% reduction on Q2.
When working with LODs in VR you quickly notice that the HMD switches LODs much earlier than the editor viewport.
This comes from differences in per-eye resolution and pixel density. To fix this mismatch we added a small function in our GameState.
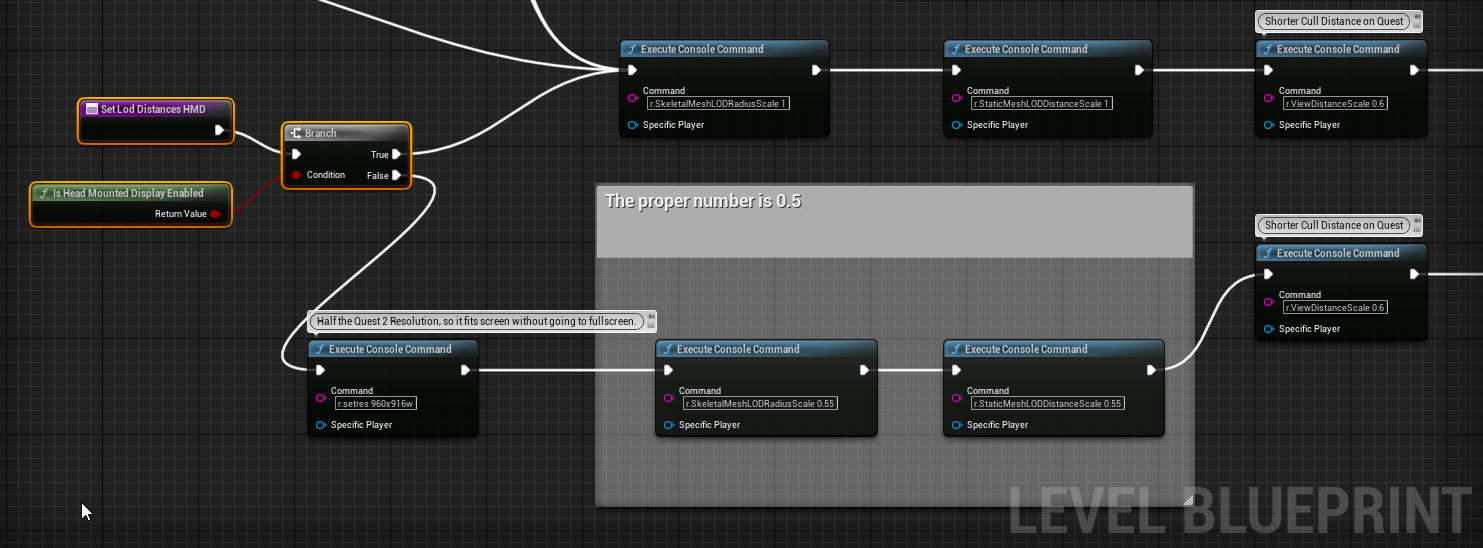 Blueprint snippet showing the key settings needed to simulate HMD LOD behavior inside the editor.
The function adjusts the editor’s render resolution and applies a set of cvars so that LOD switch distances in the viewport match what the headset actually shows. With this in place, artists could view LODs directly in the editor without constantly jumping in and out of VR to verify distances.
Ending Notes
Fixing performance was a long chain of small changes, and I have not covered all of them here. But I tried to cover the most impactful fixes here. Different culling solutions, instancing, LOD tuning, detail modes, CPD, color atlases, and most importantly, engineering taking the time to turn Snow Occlusion into a proper tool.
I hope this post was interesting and maybe gave you a few ideas on how you can keep performance under control in your own VR projects.
Comments
Reply on Bluesky to leave a comment.